Released along with the report on the July CPI was the employment report for June, and it’s certainly at odds with the prevailing market sentiment (‘000):
Monday, August 26, 2013
June 2013 Employment
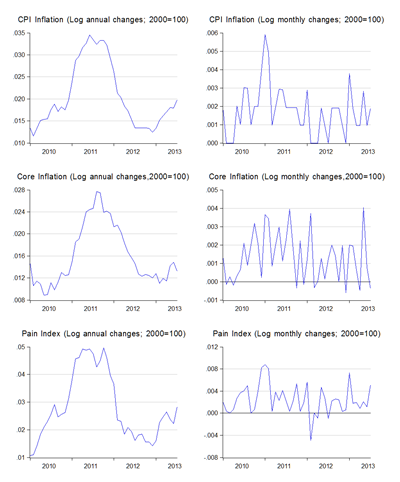
July 2013 Consumer Prices
Overshadowed by last week’s release of GDP data were five (count’em, five) other important data releases, one of which was the report on July consumer prices. Needless to say, the report showed accelerating price increases (log annual and monthly changes; 2000=100):
Thursday, August 22, 2013
2Q2013 National Accounts
Yesterday’s GDP release showed the Malaysian economy continuing to expand, but well below expectations (log annual changes, 2005=100):
Wednesday, August 21, 2013
Corruption Is Higher Than Perceived
From a recent World Bank policy research working paper (abstract):
Misunderestimating corruption
Kraay, Aart; Kraay, Aart; Murrell, PeterSummary: Estimates of the extent of corruption rely largely on self-reports of individuals, business managers, and government officials. Yet it is well known that survey respondents are reticent to tell the truth about activities to which social and legal stigma are attached, implying a downward bias in survey-based estimates of corruption. This paper develops a method to estimate the prevalence of reticent behavior, in order to isolate rates of corruption that fully reflect respondent reticence in answering sensitive questions. The method is based on a statistical model of how respondents behave when answering a combination of conventional and random-response survey questions. The responses to these different types of questions reflect three probabilities -- that the respondent has done the sensitive act in question, that the respondent exhibits reticence in answering sensitive questions, and that a reticent respondent is not candid in answering any specific sensitive question. These probabilities can be estimated using a method-of-moments estimator. Evidence from the 2010 World Bank Enterprise survey in Peru suggests reticence-adjusted estimates of corruption that are roughly twice as large as indicated by responses to standard questions. Reticence-adjusted estimates of corruption are also substantially higher in a set of ten Asian countries covered in the Gallup World Poll.
Thursday, August 15, 2013
Contingent Liabilities: You Ain’t Seen Nuthin’ Yet
One of my favourite econs bloggers, James Hamilton, has a new working paper (abstract; emphasis added):
Off-Balance-Sheet Federal Liabilities
James D. HamiltonMuch attention has been given to the recent growth of the U.S. federal debt. This paper examines the growth of federal liabilities that are not included in the officially reported numbers. These take the form of implicit or explicit government guarantees and commitments. The five major categories surveyed include support for housing, other loan guarantees, deposit insurance, actions taken by the Federal Reserve, and government trust funds. The total dollar value of notional off-balance-sheet commitments came to $70 trillion as of 2012, or 6 times the size of the reported on-balance-sheet debt. The paper reviews the potential costs and benefits of these off-balance-sheet commitments and their role in precipitating or mitigating the financial crisis of 2008.
And people are complaining when Malaysian government contingent liabilities hit 15% of GDP. Makes you wonder, dunnit?
Of course, it’s not a totally fair comparison. The Malaysian number only encompasses government guaranteed debt, not the full extent of explicit and implicit contingent liabilities as Prof Hamilton has tabulated for the US.
Nevertheless, the US numbers are staggering – it’s the equivalent of about 500% of US GDP. While the bulk is made up of "safe” contingencies through the Federal Reserve and the iffier actuarially estimated future liabilities of the US social security and medical assistance programs, guarantees for housing and student debt take up 50% of GDP, or more than three times Malaysia’s total government guarantees. US Federal deposit insurance takes up another 50% of GDP, compared to approximately 30%-40% of GDP for Malaysia (based on PIDM figures).
Any comparable exercise for Malaysia would show piddling numbers by comparison.
Technical Notes
James D. Hamilton, "Off-Balance-Sheet Federal Liabilities", NBER Working Paper No. 19253, July 2013
Wednesday, August 14, 2013
The Fitch Rating Downgrade: Much Ado About Nothing
Right off the bat, I should say that the timing of the release of the report – just before Hari Raya – was purely coincidental, and not in any way due to hidden motives. It just so happens that Fitch’s annual rating review of Malaysia’s sovereign rating occurs about this time every year.
Nobody pays much attention when ratings are affirmed, but up or down movements are much more visible from a news-worthy perspective, and bad news trumps goods news every time. And yes, the good news/bad news phenomenon has actually got pretty solid research behind it.
Tuesday, August 13, 2013
A Belated Eid Mubarak; And I’m Back
I’ve been offline for more than a week now, but I’m back at work, refreshed and recharged. To all a happy holidays and Eid Mubarak to all muslimin and muslimah.
There’s quite a few topics that have come up over the past few weeks that I’ll have something to say on over the coming days, not least of which is the TPPA and Malaysia’s sovereign ratings. I’ve had quite a few emails asking about the former, plus attending MITI’s open day, so I’ll be writing what I think once I get my thoughts organised.


