Thursday, December 7, 2017

Effective Exchange Rate Indexes: November 2017 Update

The NEER and REER page has been updated, as has the Google Docs version.

Summary

The Ringgit has continued to strengthen across October and November. The yoy growth numbers all turned positive in November with the exception of the Real ASEAN sub-index, while mom growth has been positive for three months running. Gains were broad based, though skewed a little more against the majors, and less so against regional counterparts. The Broad Nominal Index rose 0.36% in October and 1.26% in November, while the Broad Real Index rose 0.72% in October and 1.30% in November.

In November, the only drop recorded was against the KRW (-1.35%), which has been on a tear this year. The biggest gain recorded was against the AUD (Oct: 1.89%; Nov: 3.64%).

01_eer

Changelog:

  1. Indexes have been updated to November 2017
  2. CPI deflators and forecasts have been updated for October/November 2017

Monday, November 13, 2017

Chart of the Week: Don’t Bet On Real Trade Growth

It was a good run, but Malaysia’s trade growth numbers will “normalise” within the next couple of months (RM millions):

01_trade

However, this is partly a price phenomenon (index numbers; 2010=100):

02_vol_val

On the import side, it’s food, fuel, and edible oils and fats; on the export side, fuel and electronics. Import volume, like imports overall, appear to have plateaued, but there’s still some export volume upside, which is still fairly broad-based.

Two conclusions: Despite the steady increase in export volume, I think this runup is at an end – there’s a lot of volatility in the sub-indices, which means that this increase is hiding a lot of movement underneath. The price trends are mostly oil & gas related. Trade volume in the rest of East Asia has also plateaued, so most of the double-digit growth we’re still seeing across the region is simply from the low base last year. That implies growth rates will gradually drop to “normal” levels, which means something in the low single digits again, as the base shifts to the higher numbers seen earlier this year.

Friday, November 10, 2017

Taxing Land

I’ve been meaning to highlight this, but better late than never (excerpt):

Faster Growth Begins With a Land Tax in U.S. Cities
This would lower land costs, encouraging affordable housing and more density.
By Noah Smith

…In cities, especially large metropolises like New York and tech hubs like San Francisco, the land under a building is often worth a lot more than the buildings itself. When a city gets denser or more desirable, lucky landowners reap windfalls as land prices appreciate. But these windfalls aren’t just unfair -- they raise both rents and housing prices, pushing potential new residents out of a city and choking off its growth.

So it makes sense to tax the value of land. A land-value tax, or LVT, is like a property tax, but with a deduction for the value of buildings and other improvements. The tax would reduce land prices and increase the incentive to build more, which in turn will help drive down rents, making a city more affordable. And because land is a fixed quantity, taxing it doesn’t shrink the economy like taxes on wages and capital sometimes do. Also, since you’re taxing a windfall, it’s hard for landowners to argue that the tax isn’t fair. The money raised with a land-value tax can be spent building affordable housing for the poor.

Therefore, a land-value tax is an efficient and fair way to take a city that now works only for lucky prosperous landowners, and turn it into a place where the working class can afford to make a decent life….

…In the U.S., Pennsylvania is the LVT trailblazer. More than a dozen cities in that state use split-rate taxation -- one tax on land value, and a lower rate on improvements, such as buildings. Some of these experiments, like the one in Altoona, have failed, probably due to ineffective implementation and businesses’ failure to understand the novel tax structure.

But in Pittsburgh, a large city where valuable locations are scarce, the tax has been a success….

BNM Watch: The Countdown Has Started

Yesterday’s MPC statement is about as clear a statement of intent as you can get from a central bank (excerpt; emphasis added):

Monetary Policy Statement

...At the current level of the OPR, the stance of monetary policy remains accommodative. Given the strength of the global and domestic macroeconomic conditions, the Monetary Policy Committee may consider reviewing the current degree of monetary accommodation. This is to ensure the sustainability of the growth prospects of the Malaysian economy....

Tuesday, November 7, 2017

Thoughts on Alternative Budget 2018

So, I’ve finally sat down to read through Pakatan Harapan’s alternative budget for 2018. There are some good ideas here, and a fair share of bad ones, but no more than expected. The numbers are bonkers, but I expected that since this is more a political manifesto than a real fiscal document. I’ll give most of it a pass except the more egregious ones, and like many, I note that some of the policy objectives and prescriptions are contradictory. At least one proposal has me upset, but I’ll leave that for the very last.

Can the (overall) numbers be achieved? I’d say yes. If the government really wanted to, they could go with a balanced budget tomorrow. But I think it would involve as much cutting the provision of public goods and services, as it would be some putative “savings'” from reducing corruption and improving governance. I’m sceptical that there’s that much savings to be had from that source.

Wednesday, November 1, 2017

Thoughts on Budget 2018

I missed most of the Budget speech this year, having just landed from an overseas trip. That and jet lag meant I’m late in catching up on things, and today’s the first day I’m comfortable enough with the numbers and the anmouncements to actually comment on them. I’ll have something more to say about the opposition’s alternative budget(s) later.

First up, on the economic forecasts (2017: 5.2%-5.7%; 2018: 5.0%-5.5%). They’re eminently achievable, especially with the high frequency data coming in. The numbers continue to surprise on the upside, though some of that is coming from the low base we had last year. Even if we see just trend growth for the rest of 2017 and into 2018, the forecasts should bear out.

Friday, October 13, 2017

Effective Exchange Rate Indexes: September 2017 Update

The NEER and REER page has been updated, as has the Google Docs version.

Summary

September was a turnaround month for the Ringgit. The year on year changes are still negative, but all six indices posted gains on the month, and the best positive performance since May-17. Capital inflows were apparently the main reason. The Broad Nominal index rose 1.26%, while the Broad Real index rose 1.04%.

On a bilateral basis, the Ringgit rose against 14 out of 15 currencies. The biggest gains were against the JPY (+2.66%), the INR (+2.49%), the KRW (+1.86%), the USD (+1.72%), and the PHP (+1.70%). The only drop recorded was against the GBP (-1.22%).

01_indexes

Changelog:

  1. Indexes have been updated to September 2017
  2. CPI deflators and forecasts have been updated for August/September 2017

Thursday, October 5, 2017

Central Banks Can’t Go Bankrupt

Continuing on the FX theme and the recent RCI, something’s puzzled me for quite a few years. Why did BNM and/or the government decide to “amortise” the FX losses, rather than take them on BNM’s balance sheet at once?

For the uninitiated, BNM’s losses of approximately RM31.4b in the early 1990s were progressively “written-off” on a gradual basis over a period of 10 years beginning in 1993. My memory on this is a bit hazy, but my understanding was that the losses were carried as memo items, and periodically written off against the Bank’s annual profits (and euphemistically carried as “deferred expenditure” on the asset side of the Bank’s balance sheet).

The main effect of this clever piece of accounting, or boondoggle depending on your perspective, is that it preserved the illusion that BNM’s equity base remained in the black. Writing off the lossses at one go would have wiped out BNM’s equity and accumulated reserves (not to be confused with FX reserves) of about RM13.6b (at the end of 1991), resulting in the central bank being technically insolvent, or more vulgarly, bankrupt.

Wednesday, October 4, 2017

Chart of the Week: Valuing the Ringgit

I’ve done this exercise once before (see here), but this way is probably a lot more intuitive for most people. The TL:DR version – the Ringgit is undervalued, but not by much:

01_usdmyr

The chart above has the USDMYR exchange rate on the right, and the Fed’s USD broad nominal effective exchange rate on the left, from 2005 to the present. The correlation is very close – better than 95%. In other words, almost all the variation in the MYR exchange rate has come from movements in the USD rather than factors idiosyncratic to the MYR.

I won’t say that the gaps between the lines are good measures of the MYR’s over- or under-valuation, but they are indicative. In the MYR’s recent history, there’s been two episodes of obvious misalignment, roughly from mid-2015 to early-2016, and from the end of 2016 to the present.

The first you can probably call the 1MDB effect, and just like in my previous exercise, you can say it was indeed a factor in pushing down the MYR. However, the effect was short-lived, again roughly coinciding with the sale of Edra Energy.So to the idea that 1MDB, and Malaysian governance generally, has any bearing on the Ringgit exchange rate: please go away. You’re not relevant anymore.

The second coincided with the US elections and probably more pertinently, BNM’s reaction to the change in global capital flows it triggered. I’d call this the fear-of-capital-controls effect. It’s still persisting, and I’d call it a roughly 5% deviation from where the MYR should be (around RM4.00 to the USD).

The bottom line is: Yes, the Ringgit is undervalued, but probably not as much as people think.

Wednesday, September 20, 2017

Historical Revisionism: The MYR and SGD in the 1980s

I came across this a couple of weeks ago, but didn’t have time to address it then (excerpt):

A kleptocracy premium for the ringgit
P Gunasegaram

A QUESTION OF BUSINESS | Without a doubt the ringgit is historically rather weak even if the economy still continues to grow at a relatively healthy pace – the latest figures show a good growth of 5.8% for the second quarter of the year….

…So why does the ringgit remain weak, trading at levels which are weaker than at the height of the 1997/98 Asian financial crisis? What is it that is happening that keeps the ringgit level depressed? Perhaps it is due to a risk premium on the ringgit following the emergence of kleptocracy (re: 1MDB where as much as RM40 billion could be at risk, as thieves dip their fingers into money borrowed by a government company via bond issues) or apprehension over the ongoing spate of mega projects (re: the RM55 billion East Coast Rail Link whose cost may go to over RM100 billion….

Thursday, September 14, 2017

Housing, Inflation and the Cost of Living

I came across a couple of really good articles over the last couple of days on the subject of housing, inflation and GDP that I wanted to share (jump to the end for a summary of both articles).

First, the treatment of housing in the construction of the Consumer Price Index, which is commonly used to measure inflation (excerpt):

Headline inflation measures shouldn’t ignore costs of home ownership
Mojmir Hampl, Tomas Havranek 12 September 2017

Statistical offices of many countries measure the costs of home ownership by computing imputed rents, which are then included in headline inflation measures. This is the case for the US, Japan, and Switzerland, among others. In contrast, the harmonised index of consumer prices (HICP) – the EU’s most important inflation statistic – excludes owner-occupied housing, for the technical reason that imputed transactions are inconsistent with the definition of the HICP, and a more complex approach based on net acquisitions would be required (Eurostat 2012, 2013).….

…Because house purchases involve a substantial investment component, their inclusion in headline inflation makes many statisticians uneasy. Conceptually, however, homes are a special case of durable goods, because they provide a claim on a stream of future services. Cecchetti (2007), for example, showed the long-term capital gain from home ownership is very small….

Friday, September 8, 2017

Effective Exchange Rate Indexes: August 2017 Update

The NEER and REER page has been updated, as has the Google Docs version.

Summary

August was not a good month for the Ringgit, with drops posted across all six indices. Most of the losses were due to safe haven buying of the JPY and EUR, along with skepticism over the trajectory of US policy, both fiscal and monetary. The result was a -1.21% mom decline in the Narrow Nominal Index and a –1.17% drop in the Real Narrow Index.

On a bilateral basis it was a mixed bag, with gains recorded against 7 out of 15 currencies. The biggest drops were against the EUR (-2.31%), the JPY (-2.21%), the CNY (-1.42%), the AUD (-1.30%), and the THB (-1.26%). The largest gains were against the PHP (+0.84%) and the GBP (+0.47%).

01_indexes

Changelog:

  1. Indexes have been updated to August 2017
  2. CPI deflators and forecasts have been updated for July/August 2017
  3. Trade weights have been updated to 2Q2017, which entails revisions for Mar-Jul 2017

Wednesday, September 6, 2017

Guys, This Argument Is A Total Waste Of Time

YB Rafizi Ramli is claiming that income tax collection has exceeded the rate of growth of the economy (excerpt, emphasis added):

PENINGKATAN KUTIPAN CUKAI PENDAPATAN SEJAK DATO’ SERI NAJIB MENJADI PM SUDAH PUN TINGGI, SEKARANG LHDN TERUS KEJAR RAKYAT

…Maknanya, dalam tahun 2017 ini pentadbiran Dato’ Seri Najib dijangka akan mengutip hampir sekali ganda lebih banyak cukai pendapatan (pada jumlah RM112 bilion) berbanding kutipan tujuh tahun lalu iaitu 2010 semasa beliau mula-mula menjadi Perdana Menteri (pada jumlah RM60.3 bilion).

Malah, kenaikan purata tahunan sepanjang tempoh 2010 ke 2017 (disebut cumulative annual growth rate atau CAGR) adalah 11%, iaitu kadar bertambahnya kutipan cukai tahunan secara purata di antara 2010 ke 2017 sebanyak 11% setiap tahun….

…1. Pertumbuhan ekonomi negara hanyalah sekitar 5% sahaja dalam tempoh yang sama. Jika ekonomi tumbuh hanya 5%, maknanya rakyat tidak merasa kenaikan gaji yang mendadak dan peniaga juga tidak merasa keuntungan yang mendadak yang membolehkan LHDN mengutip cukai yang lebih tinggi

Tuesday, September 5, 2017

Teaching Moments

Angst over GST seems to be rising, or at least being more deliberately aired. I’m feeling like a broken record (for those under the age of 40, this is what that phrase means).

First up (except):

On Bruce Gale’s Najibnomics
By TK Chua

…The author wrote as if 1MDB, FGV and the controversial Arab donation are trivial matters. Are these not matters closely related to the poor governance, malfeasance and lack of confidence that the country is facing now? How else is the management of an economy perceived to be in good hands if not through the manner in which public finance is managed?

The author talked about “inherited” problems, such as public debt, which is strictly not the fault of the current administration. It was due to a single year’s pump priming in 2009 when the present prime minister first assumed office.

Perhaps it is time for the author to look further afield – at off budget agencies, public enterprises and GLCs, the massive loans of which are guaranteed by the federal government. Perhaps he should also look at new loans to be disbursed soon on new mega projects such as the ECRL and other gateways, the viability of which are deemed doubtful by many….

Monday, August 21, 2017

The (Un)affordability of Housing

I’ve been planning on posting this for a while now, but came across this article this past weekend, which provides the perfect entree (excerpt):

Property market bubble set to burst, says think tank

PETALING JAYA: The property bubble in Malaysia is set to burst, but the government must resist the temptation to intervene and allow market forces to coordinate supply and demand, says a think tank.

In an interview with FMT, the Institute for Democracy and Economic Affairs’ (IDEAS) senior fellow, Carmelo Ferlito explained the two “economic dynamics” which have resulted in the current property situation in the country, where the prices of homes are beyond the reach of most and the oversupply of such homes, has led to many being left unsold.

Figures from the National Property Information Centre (Napic) have indicated that as of the first quarter of 2017, some RM10.08 billion worth of residential units are unsold in Malaysia. This figure does not include serviced apartments, which have since 2015, been classified as commercial properties.

Friday, August 18, 2017

Housing Watch

BNM has a new microsite dedicated to providing info on the housing market, including info on the market, financing stats, and policy measures. Check it out here.

Chart of the Week: Healthcare Costs

The Edge has an article on medical inflation, citing a source claiming it will rise at a double digit pace this year. I hate to break it to people, but this has been the norm, both for Malaysia as well as globally.

Here’s the data, up to 2014 (in RM):

01_pc

Monday, August 14, 2017

The Costs and Benefits of Immigration

Nick Rowe provides a concise framework for thinking through the issues (excerpt):

Thinking about Costs and Benefits of Immigration

I find this a useful way to organise my thoughts about the costs and benefits of immigration. It may work for you too. I start out with a neutral benchmark, where immigration has neither costs nor benefits for the original population. Then I think of different ways in which that neutral benchmark could be wrong. This post is just a list (no doubt incomplete) of things that might create costs or benefits from immigration. I make no attempt to say which is bigger. It depends.

I am writing this mostly for non-economists. I should warn you that the economics of migration is not my area. I'm a macroeconomist, and most economists who specialise in immigration are microeconomists. This may give me a different perspective.

In case you think it matters: I migrated to Canada from the UK 40 years ago (and to Quebec from Ontario 30 years ago). This may influence my perspective.

And for what it's worth: I think that Canadian immigration policy is probably in the same ballpark as the right immigration policy for Canada. Though it is probably different for different countries….

The situation in Malaysia is a little different – we have mainly guest workers, rather than immigrants, though this nuance requires little modification to the framework offered above. Worth a read.

Friday, August 11, 2017

Cognitive Dissonance: Singapore Fiscal Policy

I kept getting this promoted tweet on my Twitter feed over the last couple of days, from the Lee Kuan Yew School:

I usually don’t bother with promoted tweets, but curiosity eventually won over and I read the article. It’s a fair description of Singapore’s fiscal policy framework, although the part on the management of past reserves could have been expanded for clarity (there’s no mention of GIC or Temasek in there for example, or the endowment funds the government set up).

There is however, one part I’m in violent disagreement with (excerpt; emphasis added):

Thursday, August 10, 2017

Ringgit Futures in Singapore

BNM is upset:

BNM Stance on Ringgit Currency Derivatives Products in Offshore Market

The recent introduction of the ringgit futures at the Singapore Stock Exchange (SGX) and the Intercontinental Exchange (ICE) or ICE Futures Singapore is inconsistent with Malaysia’s foreign exchange administration (FEA) policy and rules.

The Malaysian ringgit is a non-internationalised currency and thus, offshore trading of ringgit, in any form whether as a non-deliverable forward traded out of offshore financial centres or as a futures, options and other derivative contracts on exchanges outside of Malaysia, is against Malaysia’s policy.

Bank Negara Malaysia (BNM) would like to remind all market participants to observe the existing FEA rules. Contravention of the FEA is an offence under the Financial Services Act 2013 and Islamic Financial Services Act 2013. Appropriate action under the law will be taken against any person that does not comply with prevailing rules and regulations. Foreign participants should access the onshore ringgit foreign exchange market to meet their financial needs, either directly with onshore licensed financial institutions or their Appointed Overseas Office (AOO).

Wednesday, August 9, 2017

Chart of the Week: RON95 Petrol Price Vs Volume

Malaysian consumers mostly responding to price signals (quarterly MYR average prices, log annual and quarterly changes):

01_ron95

When the administered RON95 price was raised in 2013, there was little change in demand growth. It was still running at roughly 5% per annum. However, when the oil price drop in 2014 started feeding through into retail petrol prices, there was a steep rise in demand. A bit of an oddity, considering that the economic situation was less than ideal – or maybe it was because outbound tourism became more expensive, so people took to domestic travelling more.

In any case, the volume has lately become much more sensitive to prices (a signalling effect from monthly/weekly price volatility? worth keeping track of). For 1Q17, there was a sharp drop-off in purchases of petrol. From my point of view that’s ideal – a Pigovian tax on petrol (like tacking on GST) would then have the desired effect on consumer behaviour.

One thing the charts above don’t show however, is just how much petrol Malaysians are consuming. It’s sobering (index numbers; 2010=100):

02_volume

Consumption of petrol is 70% higher than it was in 2010, and 2/3rds of the increase has come over the past three years alone.

Technical Notes:

  1. RON95 retail prices from Galvin Tan’s blog and press anouncements
  2. Retail fuel volume data from the Quarterly Distributive Trade Index reports from the Department of Statistics

Tuesday, August 8, 2017

Food Stamps Don’t Work

I remember, when the debate over BR1M was getting started years ago, some people thought that food stamps or vouchers would be preferred. Two reasons were given for this: first that any assistance should be in a form that directly assists the poor, and second so that they don’t spend it on anything else (such as cigarettes or worse).

I preferred a cash transfer – conditional if possible, but unconditional if that couldn’t be done. My suggestion at the time (in response to the criticisms) was to only give cash to the women of the households. Obviously, that suggestion won’t fly in our society. An alternative would be to make food vouchers (or any other kind of vouchers) freely tradeable or convertible into cash. That didn’t get any kind of reception either.

But having read the following (the first is a working paper, the second is a book on US poverty), I’m now convinced more than ever that food stamps were a bad idea, and possibly worse than no assistance at all (abstract):

Monday, August 7, 2017

Effective Exchange Rate Indexes: July 2017 Update

The NEER and REER page has been updated, as has the Google Docs version.

Summary

After two months of gains, the Ringgit has reversed course, seeing declines across all six indexes. The REER is roughly where it was back in December, though the NEER managed to hold on to some gains, and is only slightly below November’s level. Overall, most of the indexes lost about -0.80% for July versus June, except for the narrow REER, which lost a little over -1.03%.

On a bilateral basis, losses were recorded against 12 out of the 15 currencies tracked. The biggest losses were against the AUD (-3.44%), the EUR (-2.85%) and the GBP (-1.73%), with the only gains recorded against the PHP (1.16%), the JPY (1.04%) and the TWD (a marginal 0.13%).

01_indexes

Changelog:

  1. Indexes have been updated to July 2017
  2. CPI deflators and forecasts have been updated for June/July 2017

More Reserve Gibberish

Scenario 1:

I borrow $100 from my neighbour Adam for a month and give him an IOU. In my books, I’ll have $100 in liabilities to Adam that I have pay back in 30 days, while Adam has an asset of $100 that he can claim from me. Adam is however short of cash, and sells my IOU to Chong across the street a week later. In my books, I still owe $100 in 3 weeks time, but this time to Chong. From my point of view, it hardly matters where the money came from – I still have to pay it back based on the IOU. The important point here is that the debt outstanding remains $100. The transfer of the debt liability from Adam to Chong doesn’t constitute an increase in my borrowing.

Scenario 2:

Muthu is going on holiday and wants my help to take care of his cat. So for a week, I will have a cat around the house that I’m responsible for, at the end of which I’ll have to return it to him. During that week, my balance sheet will show that I have a “debt” of 1 cat to Muthu (it shows as an asset on his balance sheet). He’ll be very upset if I don’t have it when he returns.

Thursday, August 3, 2017

EIS estimation

Funny numbers (except):

Employers: Why collect RM1.6b in jobless benefits when retrenchment costs RM300m?

KUALA LUMPUR, Aug 2 — The Malaysian Employers Federation (MEF) has questioned the rationale of collecting an estimated RM1.6 billion annually for the Employment Insurance System (EIS) or over 5 times the compensation for all workers retrenched in the Asian Financial Crisis.

MEF executive director Datuk Shamsuddin Bardan based his calculations on contributions of 1 per cent from both the employer and employee (0.5 per cent each) for an average monthly salary of RM2,000 from 6.8 million private sector workers.

This would amount to about RM1.6 billion a year, while he estimated that unemployment benefits for 50,000 Malaysian workers retrenched during the 1997 crisis would total RM300 million assuming that they received half-month wages based on a RM2,000 salary for six months.

I don’t know where this figure of 50,000 job losses during the AFC comes from. One of the weaknesses of the retrenchment data is that it relies on self-reporting by employers, who don’t exactly have an incentive to report job losses.

So let me just take two industries for which we have detailed data from the economic census. Between 1996 and 2000, the construction sector lost 169k jobs, while manufacturing lost 90k jobs between 1996 and 1999, for a total of 259k jobs. That’s more than five times greater than the MEF estimate, and nearly wipes out the annual inflow.

There’s probably a good argument here for adjusting the contribution to something more realistic, but the difference is not as extreme as MEF thinks.

Reserves and Reserve Cover

This is really tiresome (excerpt):

Malaysia's Bond Recovery Is Under Threat

Malaysia’s bonds are coming back in favor but the respite may be brief. The level of the nation’s foreign reserves is coming under scrutiny as investors brace for outflows from emerging markets.

The lowest reserve adequacy in Asia is sapping demand for the securities just as they are recovering from the longest selloff by foreign investors in eight years. Relatively high foreign ownership and an acceleration in inflation from last year are adding to risks as major central banks sound increasingly hawkish on interest rates….

…Malaysia’s reserves are sufficient to finance 6.5 months of imports, according to data compiled by Commerzbank AG using a 12-month moving average. That compares with 9.9 months for Indonesia, 10.8 for Thailand, 11.2 months for the Philippines, and 21.6 for China.

Bank Negara Malaysia’s reserves amount to just 1.1 times the amount of short-term debt on issue, Commerzbank estimates. The corresponding ratio is 2.8 for Indonesia, 3.7 for the Philippines and 4.3 for India….

Wednesday, July 26, 2017

How Sustainable Is This?

I don’t really know, but I’m going to enjoy it while it lasts – I’ve been re-examining global trade data for the last month or so. This is Malaysia’s (log annual and monthly changes; seasonally adjusted):

Tuesday, July 25, 2017

Growth in Context

Just a quick note:

Growth forecasts for the Malaysian economy have been undergoing upward revisions, given the strong 1Q2017 GDP numbers and the continuing strength of trade growth and retail sales. For example, the IMF has just upgraded their 2017 forecast for Malaysian GDP growth from 4.5% to 4.8%. The official government forecast of 4.3%-4.8% will also likely follow suit in the next month or so, probably around the ballpark of 5%.

One common refrain I’m hearing in all this is: the man on the street and the businessman in his office aren’t feeling it.

Friday, July 21, 2017

Before We Start Talking About “Free” Tertiary Education…

…we need to handle this little problem:

Question:

  1. Why isn’t secondary education universal yet?
  2. What’s happening with the missing boys? Malaysia’s gender ratio is tilted to more boys, yet fewer of them enter secondary education.
  3. If you think this is bad, from my memory the secondary graduation numbers are even worse (I’ll post the chart if and when I find the numbers).

Thursday, July 20, 2017

Zero-Sum Productivity

Lord Adair Turner has a lovely article on the future of productivity (excerpt):

Is Productivity Growth Becoming Irrelevant?

LONDON – As the Nobel laureate economist Robert Solow noted in 1987, computers are “everywhere but in the productivity statistics.” Since then, the so-called productivity paradox has become ever more striking….

…As we get richer, measured productivity may inevitably slow, and measured GDP per capita may tell us ever less about trends in human welfare….

…Our standard mental model of productivity growth reflects the transition from agriculture to industry….

Wednesday, July 12, 2017

Effective Exchange Rate Indexes: June 2017 Update

The NEER and REER page has been updated, as has the Google Docs version.

Summary

Over the past two months, the Ringgit has continued to gain ground, posting advances across all six indices being tracked. Most of the gains were posted in May (2.06% in the case of the real broad index), with some follow through in June (0.31%). For the latter, most of the gains were against the periphery, as the narrow index posted a small loss (-0.01% for the real narrow index). The strongest gainer was the real ASEAN index, which rose 2.34% in May and a further 0.33% in June. All told, the Ringgit has now recovered nearly all of the ground lost in the aftermath of the US presidential election.

On a bilateral basis, gains were recorded against 13 out of 15 currencies tracked in May, and 10 out of 15 in June. Across both months, the Ringgit gained against every major currency except the EUR (-1.79%), with the biggest gainer being against the JPY (+3.59%). Also, for the first time since January 2017, the REER is above the NEER, signaling a (very minor) undervaluation.

01_indices

Changelog:

  1. Indexes have been updated to June 2017
  2. CPI deflators and forecasts have been updated for May/June 2017
  3. Trade weights have been updated to 1Q2017, which entails revisions for Jan-Apr 2017

Wednesday, July 5, 2017

Seattle’s Minimum Wage Experiment

This paper caused a stir in the economics community in the past couple of weeks (abstract):

Minimum Wage Increases, Wages, and Low-Wage Employment: Evidence from Seattle
Ekaterina Jardim, Mark C. Long, Robert Plotnick, Emma van Inwegen, Jacob Vigdor, Hilary Wething

This paper evaluates the wage, employment, and hours effects of the first and second phase-in of the Seattle Minimum Wage Ordinance, which raised the minimum wage from $9.47 to $11 per hour in 2015 and to $13 per hour in 2016. Using a variety of methods to analyze employment in all sectors paying below a specified real hourly rate, we conclude that the second wage increase to $13 reduced hours worked in low-wage jobs by around 9 percent, while hourly wages in such jobs increased by around 3 percent. Consequently, total payroll fell for such jobs, implying that the minimum wage ordinance lowered low-wage employees’ earnings by an average of $125 per month in 2016. Evidence attributes more modest effects to the first wage increase. We estimate an effect of zero when analyzing employment in the restaurant industry at all wage levels, comparable to many prior studies.

Friday, June 30, 2017

Current Account Confusion

This came out about a month ago, but the subject is important enough that it’s worth revisiting (excerpt):

The Malaysian economic indicator that is raising red flags

OF all the statistics trotted out to show the health of the economy, one indicator is causing some concern among economists, who said it spells trouble for every Malaysian over the long term.

The current account balance is a gauge for the state of the economy and if it goes into a deficit for an extended period, it affects everything from wages to the price of vegetables.

Malaysia’s current account balance still shows a surplus but the bad news is that it has been declining steadily from 2014.

Tuesday, May 23, 2017

Inflation Perceptions

The Guv on inflation perceptions (excerpt):

Why doesn’t inflation rate reflect cost of living? All about perception, BNM says

KUALA LUMPUR, May 19 ― Bank Negara Malaysia (BNM) suggested today that public perception of inflation tends to be higher than the actual rate, with the bias shaped by their personal experience of paying for food and transport.

This comes as the central bank announced a headline inflation rate of 4.3 per cent in the first quarter this year compared to 1.7 per cent in the previous quarter, owing to the hike in fuel pump prices and shortages of fresh fruit.

“Public perception of inflation is in fact influenced by frequently purchased price such as food. This item typically experience higher inflation.

“However household also spends on other items, such as clothing which are in fact experiencing price decline,” BNM governor Datuk Muhammad Ibrahim said in a press conference here.

This perception is also formed by spending on transport, a sector high price volatility, he said.

In comparison, Muhammad said the Consumer Price Index (CPI), or the inflation rate, is a reflection of overall price changes in economy that reflects average consumption of an average household.

I’ve been writing about this for years (latest here). BNM has also published an article in their quarterly bulletin that actually measures the degree of “misperception” (link here). The latter especially is worth a read. For a really deep look into the whole subject, buy the book!

Tuesday, May 16, 2017

Affin-Hwang Investment Forum 2017

I will be at the Affin-Hwang Investment Forum this Saturday morning for a panel discussion on the Malaysian Economic Outlook. It’s not free, but it’s open to the public. Details here.

Thursday, May 4, 2017

Effective Exchange Rate Indexes: April 2017 Update

The NEER and REER page has been updated, as has the Google Docs version.

Summary

For the first time since April last year, the MYR indexes have gained across the board. Having said that, the movement has been relatively small – about 0.22% on a nominal basis, and 0.27% on a inflation adjusted basis. The gains against ASEAN have been smaller, at 0.17% for both real and nominal indexes. The revised data for March however, also shows the MYR sustaining above the 100 pt index mark at 100.49, versus the preliminary reading of 99.85.

On a bilateral basis, the picture is more mixed, with gains recorded against 9 out of the 15 currencies in the broad basket. The biggest gain recorded was against the AUD (1.94%), continuing on from last month’s movement, with the KRW (0.88%) and HKD (0.84%) rounding out to the top-3. The biggest drops were against the JPY (-1.71%), GBP (-1.64%) and INR(-1.20%). The indexes continue to be crossed, with the NEER remaining above the REER.

01_indexes

Changelog:

  1. Indexes have been updated to April 2017
  2. CPI deflators and forecasts have been updated for March/April 2017. There was a technical change in the splicing procedure for Thailand’s CPI deflator, which resulted in some very minor changes to the historical series. This only affects the Real Broad and Real ASEAN indexes.

Tuesday, April 18, 2017

Chart of the Week: Malaysian Residential Housing Stock

The supply side of housing (number of units per quarter; log annual difference; 3Q2002-4Q2004):

01_graph

In the top chart, the top dotted line is the average from 2002-2008 (about 49.2k per quarter) while the bottom dotted line is the average since (about 24.4k per quarter) . In the bottom chart, the corresponding averages are 5.7% and 2.2%.

So, a big part of the reason why house price inflation increased over the past decade or so is due to the shortfall in supply.

Technical Notes:

  1. Data from various reports published by the National Property Information Centre
  2. Note that the above data series excludes service apartments to maintain consistency (2016 NAPIC data does not include service apartments)

Tuesday, April 11, 2017

Chart of the Week: Malaysian House Price Inflation

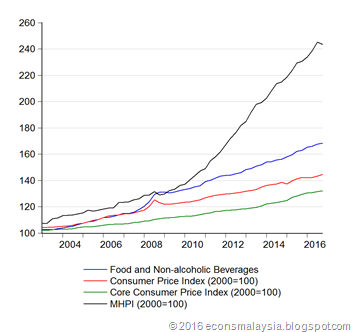
There’s inflation, there’s food inflation, but then there’s house price inflation (quarterly index numbers; 2000=100):

01_indexes

Technical Notes:

  1. Inflation numbers from the Department of Statistics Malaysia
  2. Malaysia House Price Index from NAPIC

Wednesday, April 5, 2017

Effective Exchange Rate Indexes: March 2017 Update

The NEER and REER page has been updated, as has the Google Docs version.

Summary

MYR is losing out on the emerging market rally. Both indexes continued to decline, despite stability against the USD. There was a slight uptick in the Nominal Narrow Index (top 5 trading partners), but the Real Narrow Index dropped 0.26%, as inflation accelerated faster in Malaysia. The Real ASEAN index dropped the most month on month (-0.76%), but having said that, March marks the first time this particular index has dropped below 100 since June 2000.

Despite this, on a bilateral basis, MYR appears to have turned around, or at least stopped losing ground. Gains were recorded aganst 9 out of the 15 currencies in the broad basket. The nine-month losing streak against the AUD finally ended (+0.65%), with the biggest gain coming against the GBP (+1.31%). The biggest drop was against the INR (-1.65%), followed by the TWD (-0.61%) and KRW (-0.58%).

One last thing: The indexes have crossed, with the NEER now above the REER. This is largely due to inflation in Malaysia accelerating faster than our peers. Technically, if you believe this stuff, that indicates the MYR is now overvalued, though I’d reserve judgement until I get a chance to take into account nominal interest rates as well (standard UIP model).

01_indexes

Changelog:

  1. Indexes have been updated to March 2017
  2. CPI deflators and forecasts have been updated for February/March 2017

Tuesday, April 4, 2017

Chart of the Week: Core Inflation and the Impact of GST

I was struck by a graph I saw the other day, and I’ve tried to reproduce it here. This is the still relatively new Core Inflation Index from DOSM (index numbers, log annual changes; 2010=100):

01_core

The graph of the growth (inflation) of the index is truncated because that’s more or less what’s publicly available, but trust me that the longer series shows core inflation at roughly 2% for the two years prior.

This shows very, very clearly the impact of GST, and fulfills the prediction I made nearly four years ago – GST caused an upward shift in the price level, but didn’t cause inflation (as narrowly defined by economists) to rise. It was purely a price level change, and didn’t change the slope of the index. The impact appears to be a roughly 1.8% peak to trough increase in the price level, in line with the MOF/BNM forecast.

Core inflation is currently appearing to accelerate, but that can’t be ascribed to the imposition of GST, which after all happened exactly two years ago.

Technical Notes:

Data from various Consumer Price Inflation reports from the Department of Statistics. NOTE: DOSM’s core inflation index excludes both highly volatile prices (certain seasonal foods such as vegetables) as well as petrol prices (which have been very volatile since the float in 2014). It also excludes prices of goods that are “administered” i.e. those whose prices are either fixed by the government (e.g. rice), or move due to changes in government tax policies (e.g. tobacco and alcohol). Therefore a presents a truer picture of underlying price pressures in the economy. Note that this doesn’t mean stuff doesn’t get more expensive, it just takes away the volatility in inflation, which makes it more useful for policymakers such as BNM.

Wednesday, March 29, 2017

No 47 In My List of Reasons Why Productivity Gains are so Difficult

From a batch of NBER working papers a few weeks ago (abstract; emphasis added):

CEO Behavior and Firm Performance
Oriana Bandiera, Stephen Hansen, Andrea Prat, Raffaella Sadun

We measure the behavior of 1,114 CEOs in Brazil, France, Germany, India, UK and US using a new methodology that combines (i) data on every activity the CEOs undertake during one workweek and (ii) a machine learning algorithm that projects these data onto scalar CEO behavior indices. Low values of the index are associated with plant visits, and one-on-one meetings with production or suppliers, while high values correlate with meetings with high-level C-suite executives, and several functions together, both from inside and outside the firm. We use these data to study the correlation between CEO behavior and firm performance within the framework of a firm-CEO assignment model. We show results consistent with significant firm-CEO assignment frictions, which appear to be more severe in lower-income regions. The productivity loss generated by inefficient assignment is equal to 13% of the productivity gap between high- and low-income countries in our sample.

In short, 13% of the productivity difference between rich and poor countries is due to having roughly 17% of CEOs in poorer countries not spending their time properly (relative to their industry).

And people think it’s about robots.

Technical Notes

Bandiera, Oriana & Stephen Hansen, Andrea Prat, Raffaella Sadun, "CEO Behavior and Firm Performance", NBER Working Paper No. 23248, March 2017

Tuesday, March 28, 2017

Chart of the Week: Why Seafood Prices Have Rocketed

Actually, three charts altogether:

01_production

Issue 1: Global fish landings have stagnated since the 1990s. Effectively, demand is increasingly being met through aquaculture.

02_utilisation

Issue 2: Per capita consumption has risen drastically, to over 20kg per person, tripling over the past 65 years. Roughly 85% of fish supply is now used for food, up from half in the 1970s. It’s not just population growth that is stressing fish supplies.

03_Trends

Issue 3: Only 10% of global fish stocks are underutilised. The ratio of fishing stocks that are being exploited at biologically unsustainable rates has been increasing, and is more than double what it was 40 years ago.

Technical Notes:

“The State of World Fisheries and Aquaculture 2016,” Food and Agriculture Organisation of the United Nations (FAO), 2016

Tuesday, March 21, 2017

Chart of the Week: Manufacturing Sales

Manufacturing sales versus trend forecast (RM millions):

01_sales

Boom.

Technical Notes:

Data from various issues of Monthly Manufacturing Statistics from the Department of Statistics Malaysia

Monday, March 20, 2017

The Return of Inflation?

A couple of things here:

  1. Malaysian inflation will zoom this year. No, really, for real!
  2. Uh, no, not really.

What’s with the two seemingly contradictory statements?

This is what we have up to January 2017 (log annual and monthly changes):

01_indexes

Monday, March 13, 2017

Threat or Help? Unskilled Immigrant Workers

The World Bank’s Malaysia Hub has a new brief on the effect of immigrant workers on productivity (excerpt):

Threat or Help? The Effects of Unskilled Immigrant Workers on National Productivity Growth
Sharmila Devadas

While unskilled immigrant workers have relatively low formal human capital, theory suggests that they can still contribute to productivity improvements by helping to increase efficiency and upgrading the skills of the native labor force. Empirical studies indicate that positive productivity effects do occur. This body of evidence does not provide a compelling argument for the closing of national borders to unskilled foreigners on economic grounds.

TL;DR version: The available evidence doesn’t support any negative impact on productivity, with some countries showing a positive impact. Note that this doesn’t necessarily preclude the possibility that reducing unskilled foreign workers will increase productivity, but it does make it unlikely.

Wednesday, March 8, 2017

Effective Exchange Rate Indexes: February 2017 Update

The NEER and REER page has been updated, as has the Google Docs version.

Summary

Despite relative stability against the USD in February, the MYR continued to decline on a multilateral basis. The NEER fell -0.53% mom, while the REER fell-0.91%. More moderate drops were seen in the sub-indices.

On a bilateral basis, MYR is now on a nine-month losing streak against the AUD (-2.27%), though the biggest drop was against the KRW (-3.01%). Gains were recorded against the PHP (+0.79%), HKD (+0.37%) and USD (+0.32%). What’s interesting is that, despite the continued decline, the picture appears to be balancing out a little – gains were recorded against 6 currencies (out of a total of 14 in the indexes), versus 4 last month, and just 1 in December and November.

01_idx

Changelog:

  1. Indexes have been updated to February 2017
  2. CPI deflators and forecasts have been updated for January 2016/December 2017
  3. Trade weights have been updated for the 4Q16

Tuesday, February 28, 2017

In the Shadow of the Hegemon

David Beckworth thinks the Fed is the global central bank (excerpt):

The Monetary Superpower: As Strong As Ever

[A] defining feature of the US financial system is that its central bank, the Federal Reserve, has inordinate influence over global monetary conditions. Because of this influence, it shapes the growth path of global aggregate demand more than any other central bank does. This global reach of the Federal Reserve arises for three reasons.

Friday, February 24, 2017

Corruption, Crony Capitalism and Growth

This is slowly making the rounds (excerpt):

Where Crony Capitalism Rose and Prosperity Fell (and Vice Versa)
By Matthew A. Winkler

With populists emulating autocrats from Azerbaijan to Zimbabwe, free markets are being forced to confront crony capitalism.

One response is visible in the reversal of fortunes of Malaysia and Indonesia. The two nations still wrestle with the politics of ethnicity and religion at odds with the capitalism of market competition….

…But the historic advantage that Malaysia, with just 30 million people, has enjoyed over its Southeast Asian neighbor of 250 million is disappearing amid a barrage of corruption allegations challenging Prime Minister Najib Razak….

Tuesday, February 7, 2017

Effective Exchange Rate Indexes: January 2017 Update

The NEER and REER page has been updated, as has the Google Docs version.

Summary

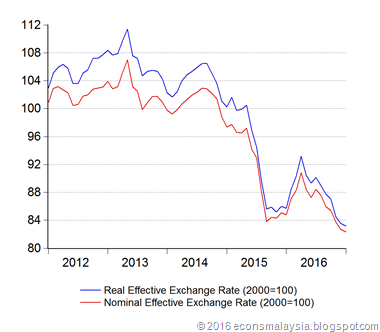
Both the NEER and REER continued to decline in January, by 0.46% and 0.44% respectively, though the depreciation pace has dropped off substantially. Again, this marks new historical lows for these indices (since the beginning of the series in January 2000).

Looking at the breakdown, however, it’s really stability against the USD (and some gains against the GBP and INR), and negative against virtually everyone else. The biggest dropoff is against the AUD, where the MYR has been on an 8 month losing streak for a cumulative -11.8%.

01_indices

Changelog:

  1. Indexes have been updated to January 2017
  2. CPI deflators and forecasts have been updated for December 2016/January 2017

Tuesday, January 3, 2017

Effective Exchange Rate Indexes: December 2016 Update

The NEER and REER page has been updated. For convenience, I’ve added a Google Docs version of the data (link at the bottom of the table).

Summary

Both the NEER and REER continued to decline in December, by 1.2% and 1.5% respectively. I haven’t extended either index before 2000, as the introduction of the Euro in 1999 makes it hideously complicated to do so, but December marks the lowest levels for either index as far as the data goes back.

Just as in November, the decline was broad-based, with the biggest drops recorded against the CNY and the USD (both -0.3%). The Ringgit however continued to climb against the JPY, up 0.35% for the month.

01_indexes

Changelog:

  1. Indexes have been updated to December 2016
  2. CPI deflators and forecasts have been updated for November/December 2016
  3. Korea has rebased their CPI to 2015, which resulted in some revisions to the broad indexes